This article uses statistical techniques to conduct sales forecasting in a business organization. Sales forecasting predicts future level of sales in a business from past sales data. Business managers rely on this data, which has been kept over a given period of time since it occurred, to predict the future.
What are statistical techniques?
Statistical techniques are a method of sales forecasting that is based on historical sales data, for example the past 12 months.
Statistical analysis investigates past sales data with an attempt to identify key features of the data such as average sales, central point of sales, frequency of sales, range of sales, variation of sales and changes in sales.
Interpreting and analyzing previous statistical data can help business managers to make well-informed assumptions what future sales results might be by comparing them with the past.
Methods of statistical techniques in sales forecasting
There are several statistical techniques that can be used to analyze the past sales data over the last 12 months. The most common thirteen methods of descriptive statistics used in business management have been grouped in five categories:
1. AVERAGE. Shows the center point of sales data:
a. Arithmetic mean – Average monthly sales
b. Median – Middle value of monthly sales
2. FREQUENCY. Shows how often particular sales occurred:
a. Mode – Most frequent monthly sales
b. Frequency data – Most frequent average monthly sales
c. Grouped frequency data – Frequency of monthly sales within different groups of sales data
3. DISPERSION. Shows how widely monthly sales are spread:
a. Range – Difference between the highest and lowest monthly sales
b. Quartiles – Distribution of monthly sales into 4 equal groups within sales data
c. Inter-quartile range – Range of the central 50% of the sales data
4. DEVIATION. Shows distance of monthly sales from the center point (mean):
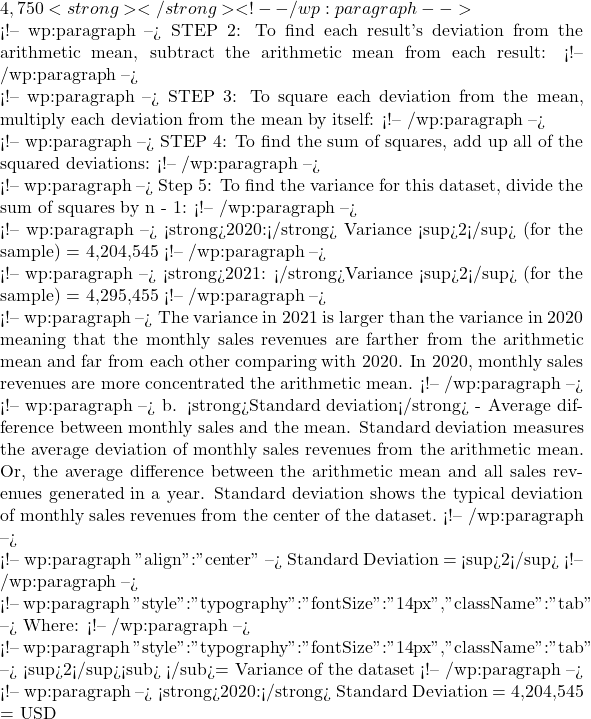
a. Variance – Spread of monthly sales from the mean
b. Standard deviation – Average difference between monthly sales and the mean
c. Mean deviation – Average of differences between monthly sales and the mean
5. CHANGE. Shows how monthly sales changed over time.
a. Index numbers – Changes in monthly sales
b. Weighted index numbers – Changes in monthly sales when months are of unequal importance
Sales forecasting is done in order to help the business identify in advance any problems and opportunities related to sales of products.
Example of using statistical techniques in a business
Let’s say that your small business generated USD

The table below shows the exact amounts of sales revenue your business generated each month in 2020 and 2021:
| MONTH: | SALES REVENUES (2020): | SALES REVENUE (2021): |
|---|---|---|
| JANUARY | USD | |
| FEBRUARY | USD | |
| MARCH | USD | |
| APRIL | USD | |
| MAY | USD | |
| JUNE | USD | |
| JULY | USD | |
| AUGUST | USD | |
| SEPTEMBER | USD | |
| OCTOBER | USD | |
| NOVEMBER | USD | |
| DECEMBER | USD | |
| TOTAL: | USD |


1. AVERAGE. It shows what the center point of the sales dataset is.
a. Arithmetic mean – Average monthly sales. This simple average shows the average monthly sales revenue in a period of one year. It is the sum of all monthly sales revenues divided by 12 months.
Arithmetic mean = (x1 + x2 + (…) + xn) / n
2020: Arithmetic mean = USD

2021: Arithmetic mean = USD
The business generated USD




b. Median – Middle value of monthly sales. Median is the middle value of monthly sales revenue. In our case, there is an even number of items (12 months) in a dataset which means that the median sales revenue will be the midpoint between the two central items (the 6th month and the 7th month in ascending dataset).
Median (even) = (1st middle value + 2nd middle value) / 2
2020: Median (even) = (USD




The median sales revenue generated by the business is USD






2. FREQUENCY. It shows how often particular sales occurred.
a. Mode – Most frequent monthly sales. The mode is the most frequently earned sales revenue in the period of 12 months.
2020: The mode of 2020’s results is USD

2021: The mode of 2021’s results is USD

b. Frequency data – Most frequent average monthly sales. Frequency data is used to show the average monthly sales revenue that appears the most frequently among all sales revenue values.
Mean frequency = ∑fx / ∑f
Where:
x – Monthly sales revenues
f – Frequency for monthly sales revenues
∑x – Sum of monthly sales revenues
∑f – Sum of frequencies for all monthly sales revenues
∑fx – Sum of monthly sales revenues x Frequency
The following table shows frequencies of monthly sales revenues in 2020:
| Sales Revenue (x): | Frequency (f): | fx: | |||||||||||||||||||||||||||||||||||||||||||||||||||||||||||||||||||||||||||||||||||||||||||
|---|---|---|---|---|---|---|---|---|---|---|---|---|---|---|---|---|---|---|---|---|---|---|---|---|---|---|---|---|---|---|---|---|---|---|---|---|---|---|---|---|---|---|---|---|---|---|---|---|---|---|---|---|---|---|---|---|---|---|---|---|---|---|---|---|---|---|---|---|---|---|---|---|---|---|---|---|---|---|---|---|---|---|---|---|---|---|---|---|---|---|---|---|---|
USD | 1 | 1000 | |||||||||||||||||||||||||||||||||||||||||||||||||||||||||||||||||||||||||||||||||||||||||||
USD | 2 | 7000 | |||||||||||||||||||||||||||||||||||||||||||||||||||||||||||||||||||||||||||||||||||||||||||
USD | 1 | 4500 | |||||||||||||||||||||||||||||||||||||||||||||||||||||||||||||||||||||||||||||||||||||||||||
USD | 1 | 5500 | |||||||||||||||||||||||||||||||||||||||||||||||||||||||||||||||||||||||||||||||||||||||||||
USD The following table shows frequencies of monthly sales revenues in 2021:
2021: Mean frequency = USD c. Grouped frequency data – Frequency of monthly sales within different groups of sales data. Grouped frequency data shows how different values of monthly sales revenue appear within different groups of sales revenue in the dataset of 12 months. Mean frequency = ∑fx / ∑f The following table shows grouped data in 2020:
2020: Mean frequency = USD The mean frequency in this business in 2020 is USD The following table shows grouped data in 2021:
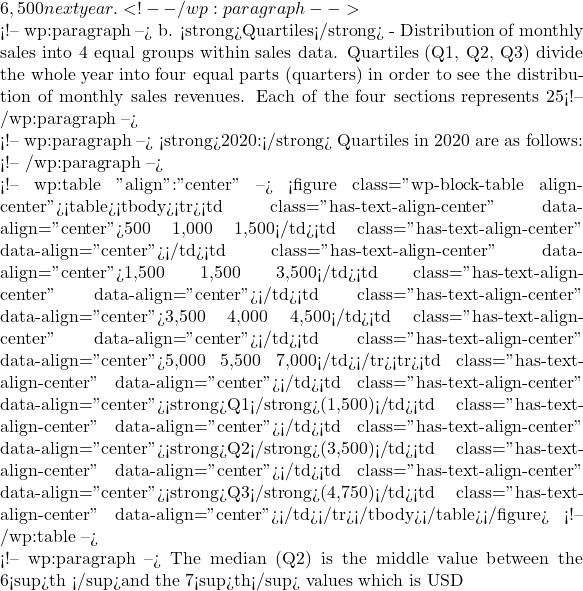
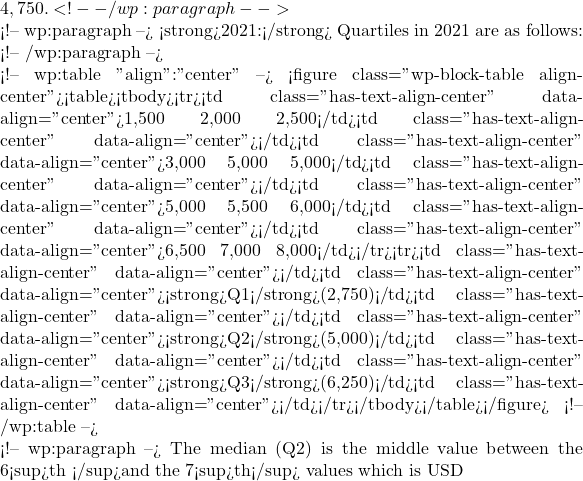
2021: Mean frequency = USD The mean frequency in this business in 2021 is USD 3. DISPERSION. It shows how widely monthly sales are spread from the lowest to the highest monthly sales revenue.a. Range – Difference between the highest and lowest monthly sales. Range is the difference between the highest and the lowest monthly sales revenue over the period of 12 months. Range = Highest result – Lowest result 2020: Range = USD The range of monthly sales revenue in 2020 is USD 2022: The range of monthly sales revenue might also be USD Let’s interpret the numbers that represent quartiles. 1. Monthly sales revenue of USD Let’s interpret the numbers that represent quartiles. 1. Monthly sales revenue of USD 3. Monthly sales revenue of USD c. Inter-quartile range – Range of the central 50% of the sales data. It is the range of monthly sales revenues between the upper quartile (Q3) and the lower quartile (Q1) in the year. It shows the range of the middle 50% of the monthly sales revenues while ignoring the bottom 25% and top 25% of the results. Inter-quartile range = Upper quartile (Q3) – Lower quartile (Q1) 2020: Inter-quartile range = USD The inter-quartile range in USD 2022: If the business increases its inter-quartile range next year by 7.7%, it will be , the median will be USD 2021: Arithmetic mean = USD 2021: Standard Deviation = √4,204,545 = USD 2021: Arithmetic mean = USD 2021: Sum of absolute deviations = USD 2021: Mean deviation (for the sample) = USD | USD | USD | USD | USD | USD | USD | USD | USD | USD | USD | USD | USD | USD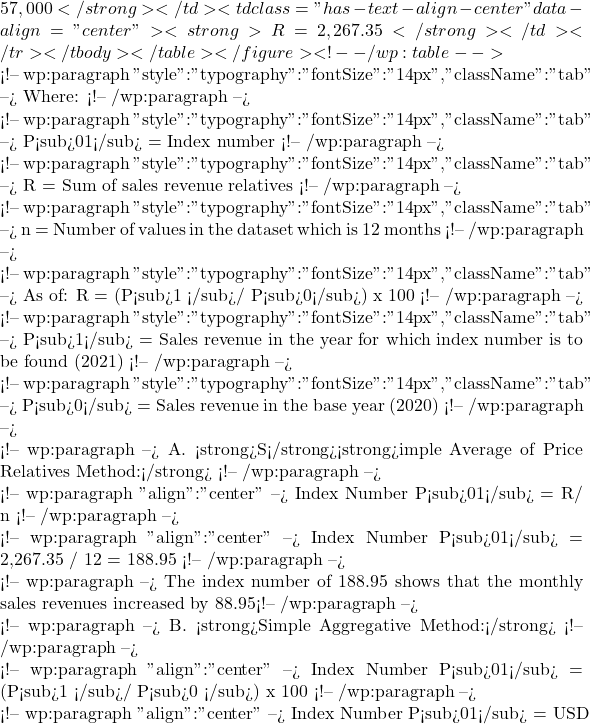 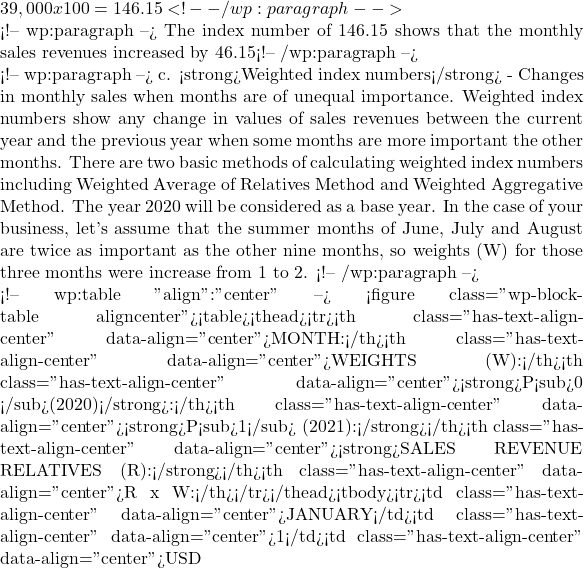 | USD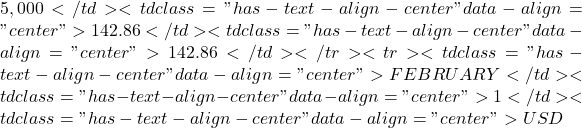 | USD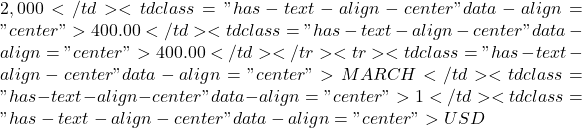 | USD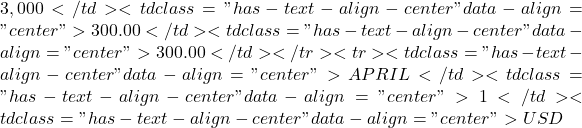 | USD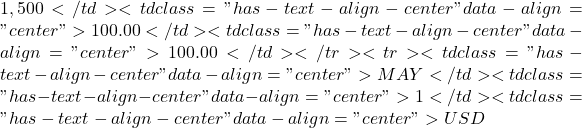 | USD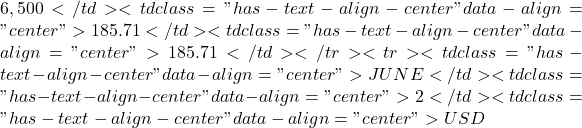 | USD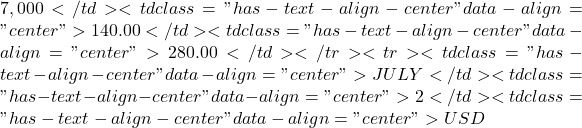 | USD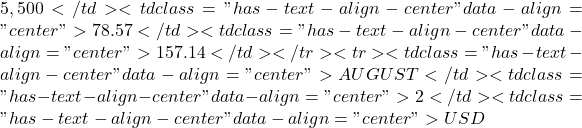 | USD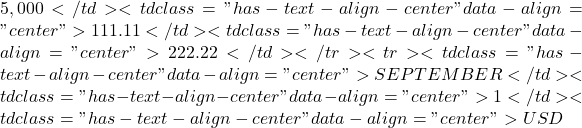 | USD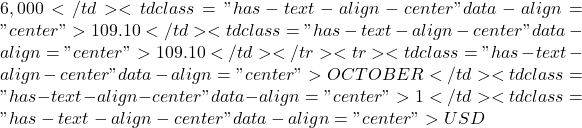 | USD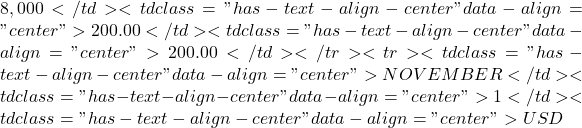 | USD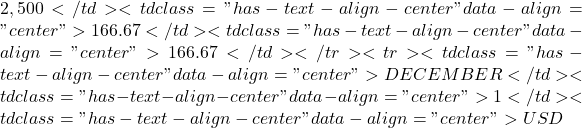 | USD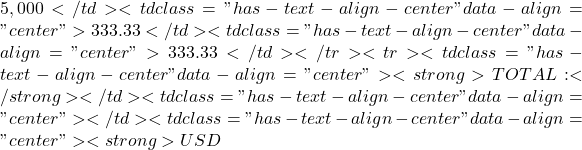 | USD$57,000 | R = 2,267.35 | R x W = 2,597.03 |


















































































![3,769.5 in 2022. <!-- /wp:paragraph --> <!-- wp:separator --> <hr class="wp-block-separator has-alpha-channel-opacity"/> <!-- /wp:separator --> <!-- wp:html --> <script async="" src="https://pagead2.googlesyndication.com/pagead/js/adsbygoogle.js?client=ca-pub-3196649779609103" crossorigin="anonymous"></script> <!-- Inside Content --> <ins class="adsbygoogle" style="display:block" data-ad-client="ca-pub-3196649779609103" data-ad-slot="4855547878" data-ad-format="auto" data-full-width-responsive="true"></ins> <script> (adsbygoogle = window.adsbygoogle || []).push({}); </script> <!-- /wp:html --> <!-- wp:separator --> <hr class="wp-block-separator has-alpha-channel-opacity"/> <!-- /wp:separator --> <!-- wp:heading {"level":3} --> <h3 class="wp-block-heading"><strong>4. DEVIATION. It shows distance of monthly sales from the center point (mean) of the sales dataset.</strong></h3> <!-- /wp:heading --> <!-- wp:paragraph --> a. <strong>Variance</strong> - Spread of monthly sales from the mean. Variance measures how monthly sales revenues in a year differ from the arithmetic mean. What is the distance between monthly sales revenues and the center of the dataset? Or, spread of monthly sales revenues from the arithmetic mean. <!-- /wp:paragraph --> <!-- wp:paragraph {"align":"center"} --> σ<sup>2 </sup>= Σ(x<sub>i</sub> - x)<sup>2</sup> / (n -1) <!-- /wp:paragraph --> <!-- wp:paragraph {"style":{"typography":{"fontSize":"14px"}},"className":"tab"} --> Where: <!-- /wp:paragraph --> <!-- wp:paragraph {"style":{"typography":{"fontSize":"14px"}},"className":"tab"} --> x<sub>i </sub>= Monthly sales revenues <!-- /wp:paragraph --> <!-- wp:paragraph {"style":{"typography":{"fontSize":"14px"}},"className":"tab"} --> x = Arithmetic mean of sales revenues during a year <!-- /wp:paragraph --> <!-- wp:paragraph {"style":{"typography":{"fontSize":"14px"}},"className":"tab"} --> n = Number of values in the dataset which is 12 months <!-- /wp:paragraph --> <!-- wp:paragraph --> STEP 1: Find the arithmetic mean by adding up all the months and divide by 12: <!-- /wp:paragraph --> <!-- wp:paragraph --> <strong>2020:</strong> Arithmetic mean = USD](https://www.SuperBusinessManager.com/wp-content/ql-cache/quicklatex.com-cdd5433be3ba7cedb71ff6c701891977_l3.png "Rendered by QuickLaTeX.com")







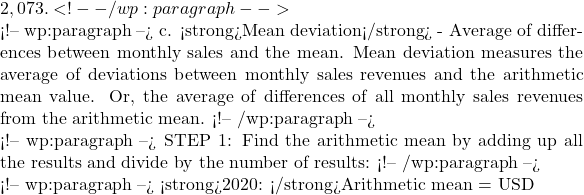

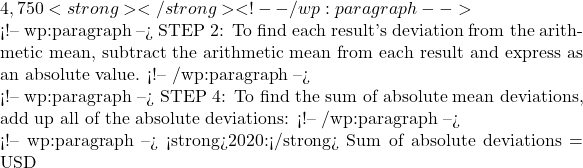

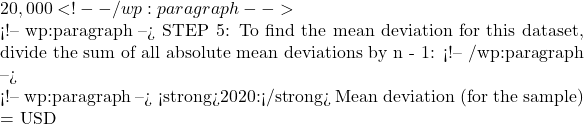





![2,073 in 2021 because the result is less impacted by the extreme values as squaring was not conducted in mean deviation. <!-- /wp:paragraph --> <!-- wp:separator --> <hr class="wp-block-separator has-alpha-channel-opacity"/> <!-- /wp:separator --> <!-- wp:html --> <script async="" src="https://pagead2.googlesyndication.com/pagead/js/adsbygoogle.js?client=ca-pub-3196649779609103" crossorigin="anonymous"></script> <!-- Inside Content --> <ins class="adsbygoogle" style="display:block" data-ad-client="ca-pub-3196649779609103" data-ad-slot="4855547878" data-ad-format="auto" data-full-width-responsive="true"></ins> <script> (adsbygoogle = window.adsbygoogle || []).push({}); </script> <!-- /wp:html --> <!-- wp:separator --> <hr class="wp-block-separator has-alpha-channel-opacity"/> <!-- /wp:separator --> <!-- wp:heading {"level":3} --> <h3 class="wp-block-heading"><strong>5. CHANGE. It shows how monthly sales changed over time.</strong></h3> <!-- /wp:heading --> <!-- wp:paragraph --> a. <strong>Index numbers</strong> - Changes in monthly sales. Index numbers show any change in values of sales revenues between the current year and the previous year. There are two basic methods of calculating simple or unweighted index numbers including Simple Average of Price Relatives Method and Simple Aggregative Method. The year 2020 will be considered as a base year. <!-- /wp:paragraph --> <!-- wp:table {"align":"center"} --> <figure class="wp-block-table aligncenter"><table><thead><tr><th class="has-text-align-center" data-align="center">MONTH:</th><th class="has-text-align-center" data-align="center"><strong>P<sub>0 </sub>(2020)</strong>:</th><th class="has-text-align-center" data-align="center"><strong>P<sub>1</sub> (2021):</strong></th><th class="has-text-align-center" data-align="center"><strong>SALES REVENUE RELATIVES (R):</strong></th></tr></thead><tbody><tr><td class="has-text-align-center" data-align="center">JANUARY</td><td class="has-text-align-center" data-align="center">USD](https://www.SuperBusinessManager.com/wp-content/ql-cache/quicklatex.com-7d42ecd65aa429511b52f58af37dd342_l3.png "Rendered by QuickLaTeX.com")


A. Weighted Average of Relatives Method:
Weighted Index Number P01 = (ΣR x W)/ ΣW
Weighted Index Number P01 = 2597.03 / 15 = 173.14
The index number of 173.14 shows that the monthly sales revenues, when different months are having different importance throughout the year, increased by 73.14% for each month between 2021 compared to 2020.
In summary, different methods of statistical techniques in sales forecasting based on historical sales data can help to analyze the past sales in order to make assumptions for the future. It helps to identify key features of the data such as average sales, central point of sales, frequency of sales, range of sales, variation of sales and changes in sales to help business managers make well-informed predictions regarding what future sales results might be referring to the past.


Comments are closed.