Change shows how the data changes over time.
In Business, Economics and Finance, change of individual observations in a dataset is statistically measured by an index. Data may be derived from many sources including market research, past company performance over the years, historical levels prices, productivity levels, employment numbers, etc. For example, economic indices such as inflation or unemployment can track economic health of the country.
The two most frequently used methods to measure change are:
1. INDEX NUMBERS
2. WEIGHTED INDEX NUMBERS
1. INDEX NUMBERS
What are index numbers? They show any change in values of individual items in a dataset, or a group of variables, across a determined period of time. Index numbers exist to simplify complex comparison of large amounts of data which are measured in different values. Researchers should always compare oranges with oranges and apples with apples to reach meaningful conclusions.
How to calculate index numbers? Firstly, work out an index. Secondly, decide on a base value of 100. Then, use the base value as a base number from which all other numbers will be compared. Finally, analyze changes in the data. An index number is always expressed in the percentage form.
In index numbers, current year refers to the year for which we aim to find the index number, and base year acts as the reference for which we wish to find the change in the value of the variable.
Example 1: The following table shows changes in the price of milk in the country over the period of four years between 2018 and 2021. The year 2018 was chosen as a base year. The index number for each year can then be calculated in the right column:
| YEAR: | PRICE OF MILK (in USD 1.00 1.00 | 100 (base) | |||||||||||||||||||||||||||
|---|---|---|---|---|---|---|---|---|---|---|---|---|---|---|---|---|---|---|---|---|---|---|---|---|---|---|---|---|---|
| 2019 | USD 1.25 / USD 1.25 / USD 1.50 1.50 | (USD 1.00) x 100 = 150 1.00) x 100 = 150 | |||||||||||||||||||||||||||
| 2021 | USD 2.00 / USD 2.00 / USD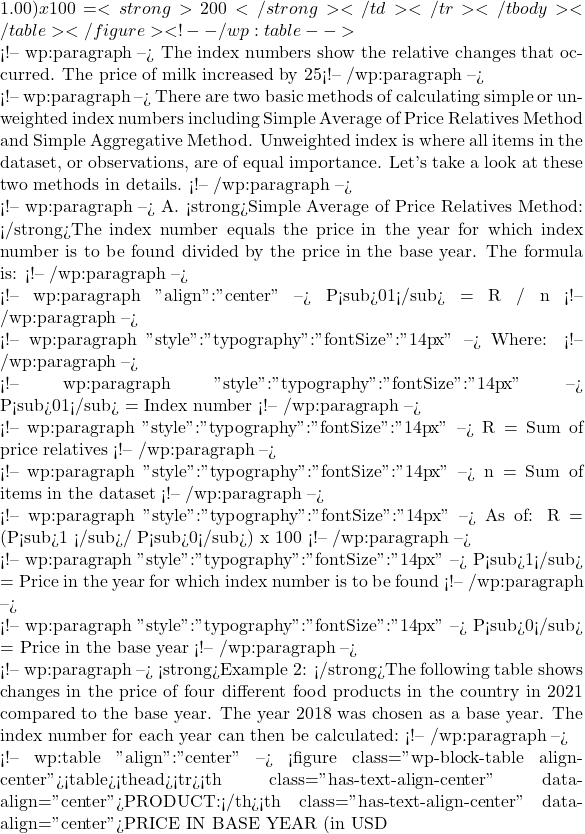 ): ): | PRICE IN CURRENT YEAR (in USD 1.00 1.00 | USD 1.50 1.50 | USD 4.00 4.00 | USD 2.50 2.50 | USD![4.00</td><td class="has-text-align-center" data-align="center">160.00</td></tr><tr><td class="has-text-align-center" data-align="center"></td><td class="has-text-align-center" data-align="center"></td><td class="has-text-align-center" data-align="center"></td><td class="has-text-align-center" data-align="center"><strong>ΣR = 676.67</strong></td></tr></tbody></table></figure> <!-- /wp:table --> <!-- wp:paragraph {"align":"center"} --> Index Number P<sub>01</sub> = ΣR / n <!-- /wp:paragraph --> <!-- wp:paragraph {"align":"center"} --> Index Number P<sub>01</sub> = 676.67 / 4 <!-- /wp:paragraph --> <!-- wp:paragraph {"align":"center"} --> Index Number P<sub>01</sub> = 169.17 <!-- /wp:paragraph --> <!-- wp:paragraph --> The index number of 169.17 shows that the prices of four different products increased by 69.17% for each of the products between 2021 compared to 2018. <!-- /wp:paragraph --> <!-- wp:separator --> <hr class="wp-block-separator has-alpha-channel-opacity"/> <!-- /wp:separator --> <!-- wp:html --> <script async="" src="https://pagead2.googlesyndication.com/pagead/js/adsbygoogle.js?client=ca-pub-3196649779609103" crossorigin="anonymous"></script> <!-- Inside Content --> <ins class="adsbygoogle" style="display:block" data-ad-client="ca-pub-3196649779609103" data-ad-slot="4855547878" data-ad-format="auto" data-full-width-responsive="true"></ins> <script> (adsbygoogle = window.adsbygoogle || []).push({}); </script> <!-- /wp:html --> <!-- wp:separator --> <hr class="wp-block-separator has-alpha-channel-opacity"/> <!-- /wp:separator --> <!-- wp:paragraph --> B. <strong>Simple Aggregative Method: </strong>The index number equals the sum of prices for the year for which index number is to be found divided by the sum of actual prices for the base year. The formula is: <!-- /wp:paragraph --> <!-- wp:paragraph {"align":"center"} --> P<sub>01</sub> = (ΣP<sub>1 </sub>/ ΣP<sub>0 </sub>) x 100 <!-- /wp:paragraph --> <!-- wp:paragraph {"style":{"typography":{"fontSize":"14px"}}} --> Where: <!-- /wp:paragraph --> <!-- wp:paragraph {"style":{"typography":{"fontSize":"14px"}}} --> P<sub>01</sub> = Index number <!-- /wp:paragraph --> <!-- wp:paragraph {"style":{"typography":{"fontSize":"14px"}}} --> ΣP<sub>1</sub> = Sum of prices for the year for which index number is to be found <!-- /wp:paragraph --> <!-- wp:paragraph {"style":{"typography":{"fontSize":"14px"}}} --> ΣP<sub>0</sub> = Sum of actual prices for the base year <!-- /wp:paragraph --> <!-- wp:paragraph --> <strong>Example 3: </strong>The following table shows changes in the price of four different food products in the country in 2021 compared to the base year. The year 2018 was chosen as a base year. The index number for each year can then be calculated: <!-- /wp:paragraph --> <!-- wp:table {"align":"center"} --> <figure class="wp-block-table aligncenter"><table><thead><tr><th class="has-text-align-center" data-align="center">PRODUCT:</th><th class="has-text-align-center" data-align="center">PRICE IN BASE YEAR (in USD](https://www.SuperBusinessManager.com/wp-content/ql-cache/quicklatex.com-9a7ba92052736d229a6f8b65417d3ed0_l3.png "Rendered by QuickLaTeX.com") ): ): | PRICE IN CURRENT YEAR (in USD 1.00 1.00 | USD 1.50 1.50 | USD 4.00 4.00 | USD 2.50 2.50 | USD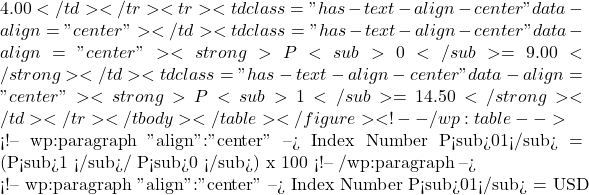 14.5 / USD 14.5 / USD![9.00 x 100 <!-- /wp:paragraph --> <!-- wp:paragraph {"align":"center"} --> Index Number P<sub>01</sub> = 161.11 <!-- /wp:paragraph --> <!-- wp:paragraph --> The index number of 161.11 shows that the prices of four different products increased by 61.11% in total between 2021 compared to 2018. <!-- /wp:paragraph --> <!-- wp:paragraph --> <strong>Uses of index numbers in business management: </strong>They are very useful in both academic as well as practical market research. Results from index numbers are used to calculate percentages which represent changes in observations in the dataset. They are also used to identify any underlying trends and make forecasts for the future. Index numbers show general relative changes and are direct measurable figures. They help to compare the levels of a certain phenomenon concerning a specific date and to that of a previous date such as comparing unemployment rate this year with unemployment year last year. <!-- /wp:paragraph --> <!-- wp:paragraph --> There are many different types of index numbers in Business Management and Economics. Classification of index numbers includes: <!-- /wp:paragraph --> <!-- wp:list {"className":"tabtab"} --> <ul class="tabtab"><!-- wp:list-item --> <li><strong>Price index numbers:</strong> It measures the changes in the prices of the commodities produced, consumed or sold in a given period with reference to the base period.</li> <!-- /wp:list-item --></ul> <!-- /wp:list --> <!-- wp:list {"className":"tabtab"} --> <ul class="tabtab"><!-- wp:list-item --> <li><strong>Quantity index numbers:</strong> These help to measure and compare the changes in the physical volume of goods produced, sold and purchased in a given period compared to some other given period.</li> <!-- /wp:list-item --></ul> <!-- /wp:list --> <!-- wp:list {"className":"tabtab"} --> <ul class="tabtab"><!-- wp:list-item --> <li><strong>Value index numbers:</strong> These indexes show changes in the value of any commodity in a given period in reference to the base period.</li> <!-- /wp:list-item --></ul> <!-- /wp:list --> <!-- wp:list {"className":"tabtab"} --> <ul class="tabtab"><!-- wp:list-item --> <li><strong>Consumer price index numbers:</strong> These indexes measure the average over time in the prices paid by the consumers for a specific group of goods and services.</li> <!-- /wp:list-item --></ul> <!-- /wp:list --> <!-- wp:list {"className":"tabtab"} --> <ul class="tabtab"><!-- wp:list-item --> <li><strong>Special purpose index numbers:</strong> These indexes are framed for a special study relating to a particular variable in a business organization or aspect in the economy.</li> <!-- /wp:list-item --></ul> <!-- /wp:list --> <!-- wp:paragraph --> <strong>Advantages of index numbers: </strong>Present data and figures which are often measured in different values can be presented in clear and concise way. It makes comparisons and interpretation easier for researchers. Index numbers have universal utility meaning that can be used to compare any changes of any phenomenon. Index numbers measure changes both in one variable and in a group of variables.<strong></strong> <!-- /wp:paragraph --> <!-- wp:paragraph --> <strong>Disadvantages of index numbers: </strong>The base year needs to be carefully chosen and updated every year. All of the items chosen to make up the index must be appropriate and correct. The reasons for changes in data are not identified as they only give a general idea of the relative changes.<strong></strong> <!-- /wp:paragraph --> <!-- wp:separator --> <hr class="wp-block-separator has-alpha-channel-opacity"/> <!-- /wp:separator --> <!-- wp:html --> <script async="" src="https://pagead2.googlesyndication.com/pagead/js/adsbygoogle.js?client=ca-pub-3196649779609103" crossorigin="anonymous"></script> <!-- Inside Content --> <ins class="adsbygoogle" style="display:block" data-ad-client="ca-pub-3196649779609103" data-ad-slot="4855547878" data-ad-format="auto" data-full-width-responsive="true"></ins> <script> (adsbygoogle = window.adsbygoogle || []).push({}); </script> <!-- /wp:html --> <!-- wp:separator --> <hr class="wp-block-separator has-alpha-channel-opacity"/> <!-- /wp:separator --> <!-- wp:heading --> <h2>2. <strong>WEIGHTED INDEX NUMBERS</strong></h2> <!-- /wp:heading --> <!-- wp:paragraph --> <strong>What is weighted index numbers? </strong>They show any change in values of individual items in a dataset, or a group of variables, across a determined period of time when some items are more important than other changes. <strong></strong> <!-- /wp:paragraph --> <!-- wp:paragraph --> <strong>How to calculate weighted index numbers?</strong> When all observations in the dataset are not of equal importance, different weights are assigned to each observation relative to its importance and index number computed from these weights is called weighted index numbers. <!-- /wp:paragraph --> <!-- wp:paragraph --> In weighted index numbers, current year refers to the year for which we aim to find the index number, and base year acts as the reference for which we wish to find the change in the value of the variable. <!-- /wp:paragraph --> <!-- wp:paragraph --> Weighted index is where all items in the dataset, or observations, are of unequal importance. Let's take a look at these two methods in details. <!-- /wp:paragraph --> <!-- wp:paragraph --> There are two basic methods of calculating weighted index numbers including Weighted Average of Relatives Method and Weighted Aggregative Method. <!-- /wp:paragraph --> <!-- wp:paragraph --> A. <strong>Weighted Average of Relatives Method: </strong>Different weights are assigned to the observations according to their relative importance as determined by the researcher. The weighted index number equals the sum of the observations' weights multiplied by price relatives for each observation, and divided by the sum of the weights. The formula is: <!-- /wp:paragraph --> <!-- wp:paragraph {"align":"center"} --> P<sub>01</sub> = (ΣR x W) / ΣW <!-- /wp:paragraph --> <!-- wp:paragraph {"style":{"typography":{"fontSize":"14px"}}} --> Where: <!-- /wp:paragraph --> <!-- wp:paragraph {"style":{"typography":{"fontSize":"14px"}}} --> P<sub>01</sub> = Index number <!-- /wp:paragraph --> <!-- wp:paragraph {"style":{"typography":{"fontSize":"14px"}}} --> ΣR = Sum of price relatives <!-- /wp:paragraph --> <!-- wp:paragraph {"style":{"typography":{"fontSize":"14px"}}} --> W = Weights of items in the dataset <!-- /wp:paragraph --> <!-- wp:paragraph {"style":{"typography":{"fontSize":"14px"}}} --> ΣW = Sum of weights of items in the dataset <!-- /wp:paragraph --> <!-- wp:paragraph {"style":{"typography":{"fontSize":"14px"}}} --> As of: ΣR = (P<sub>1 </sub>/ P<sub>0</sub>) x 100 <!-- /wp:paragraph --> <!-- wp:paragraph {"style":{"typography":{"fontSize":"14px"}}} --> P<sub>1</sub> = Price in the year for which index number is to be found <!-- /wp:paragraph --> <!-- wp:paragraph {"style":{"typography":{"fontSize":"14px"}}} --> P<sub>0</sub> = Price in the base year <!-- /wp:paragraph --> <!-- wp:paragraph --> <strong>Example 4: </strong>The following table shows changes in the price of four different food products in the country in 2021 compared to the base year. The weights were assigned based on the quantity of each product sold in the country in the base year. The year 2018 was chosen as a base year. The index number for each year can then be calculated: <!-- /wp:paragraph --> <!-- wp:table {"align":"center","style":{"typography":{"fontSize":"11px"}}} --> <figure class="wp-block-table aligncenter" style="font-size:11px"><table><thead><tr><th class="has-text-align-center" data-align="center">PRODUCT:</th><th class="has-text-align-center" data-align="center">WEIGHTS (W):</th><th class="has-text-align-center" data-align="center">PRICE IN BASE YEAR (in USD](https://www.SuperBusinessManager.com/wp-content/ql-cache/quicklatex.com-bdaf2b314d0af5c38f521dc1086fab76_l3.png "Rendered by QuickLaTeX.com") ): ): | PRICE IN CURRENT YEAR (in USD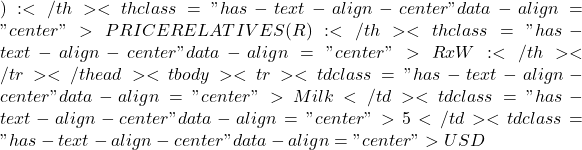 1.00 1.00 | USD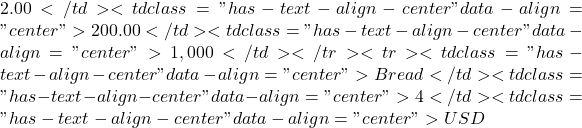 1.50 1.50 | USD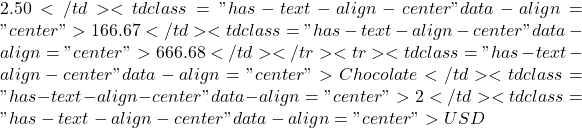 4.00 4.00 | USD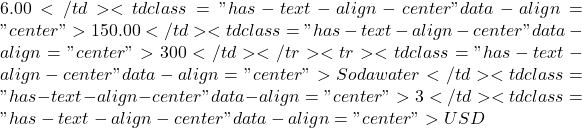 2.50 2.50 | USD![4.00</td><td class="has-text-align-center" data-align="center">160.00</td><td class="has-text-align-center" data-align="center">480</td></tr><tr><td class="has-text-align-center" data-align="center"></td><td class="has-text-align-center" data-align="center"><strong>ΣW = 14 </strong></td><td class="has-text-align-center" data-align="center"></td><td class="has-text-align-center" data-align="center"></td><td class="has-text-align-center" data-align="center"></td><td class="has-text-align-center" data-align="center"><strong> ΣR x W = 2,446.68</strong></td></tr></tbody></table></figure> <!-- /wp:table --> <!-- wp:paragraph {"align":"center"} --> Weighted Index Number P<sub>01</sub> = (ΣR x W) / ΣW <!-- /wp:paragraph --> <!-- wp:paragraph {"align":"center"} --> Weighted Index Number P<sub>01</sub> = 2446.68 / 14 <!-- /wp:paragraph --> <!-- wp:paragraph {"align":"center"} --> Weighted Index Number P<sub>01</sub> = 174.76 <!-- /wp:paragraph --> <!-- wp:paragraph --> The index number of 174.76 shows that the prices of four different products having different importance in the index increased by 74.76% for each of the products between 2021 compared to 2018. <!-- /wp:paragraph --> <!-- wp:separator --> <hr class="wp-block-separator has-alpha-channel-opacity"/> <!-- /wp:separator --> <!-- wp:html --> <script async="" src="https://pagead2.googlesyndication.com/pagead/js/adsbygoogle.js?client=ca-pub-3196649779609103" crossorigin="anonymous"></script> <!-- Inside Content --> <ins class="adsbygoogle" style="display:block" data-ad-client="ca-pub-3196649779609103" data-ad-slot="4855547878" data-ad-format="auto" data-full-width-responsive="true"></ins> <script> (adsbygoogle = window.adsbygoogle || []).push({}); </script> <!-- /wp:html --> <!-- wp:separator --> <hr class="wp-block-separator has-alpha-channel-opacity"/> <!-- /wp:separator --> <!-- wp:paragraph --> B. <strong>Weighted Aggregative Method: </strong> <!-- /wp:paragraph --> <!-- wp:paragraph --> In this method, different weights are assigned to the items according to their relative importance. Weights are typically assigned based on the quantity sold. Many formulae have been developed to estimate index numbers on the basis of quantity weights. There are four main methods of calculating weighted aggregative method index numbers including Laspeyre's Index Numbers, Paasche's Index Numbers, Dorbish and Bowley's Index Numbers and Fisher's Ideal Index Numbers. What makes each method different from one another is that either the base year quantities are used as weights or the current year quantities or maybe the combination of both. <!-- /wp:paragraph --> <!-- wp:paragraph --> Let's take a look at these four methods in details. <!-- /wp:paragraph --> <!-- wp:paragraph --> <strong>Example 5: </strong>The following table shows changes in the price of four different food products in the country in 2021 compared to the base year. The weights were assigned based on the quantity of each product sold in the country in both the base year and the current year. The year 2018 was chosen as a base year. The index number for each year can then be calculated: <!-- /wp:paragraph --> <!-- wp:table {"align":"center","style":{"typography":{"fontSize":"11px"}}} --> <figure class="wp-block-table aligncenter" style="font-size:11px"><table><thead><tr><th class="has-text-align-center" data-align="center">PRODUCT:</th><th class="has-text-align-center" data-align="center">BASE YEAR Price (P<sub>0)</sub>:</th><th class="has-text-align-center" data-align="center">BASE YEAR Quantity (Q<sub>0)</sub>:</th><th class="has-text-align-center" data-align="center">CURRENT YEAR Price (P<sub>1)</sub>:</th><th class="has-text-align-center" data-align="center">CURRENT YEAR Quantity (P<sub>1)</sub>:</th><th class="has-text-align-center" data-align="center">P<sub>0</sub>Q<sub>0</sub></th><th class="has-text-align-center" data-align="center">P<sub>1</sub>Q<sub>0</sub></th><th class="has-text-align-center" data-align="center">P<sub>0</sub>Q<sub>1</sub></th><th class="has-text-align-center" data-align="center">P<sub>1</sub>Q<sub>1</sub></th></tr></thead><tbody><tr><td class="has-text-align-center" data-align="center">Milk</td><td class="has-text-align-center" data-align="center">USD](https://www.SuperBusinessManager.com/wp-content/ql-cache/quicklatex.com-5210dcce44dd217a68ed14aac3724f24_l3.png "Rendered by QuickLaTeX.com") 1.00 1.00 | 5 | USD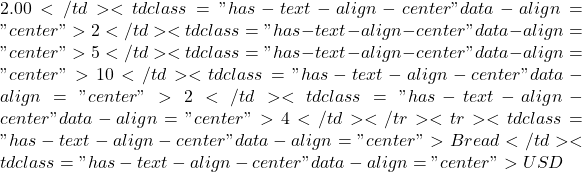 1.50 1.50 | 4 | USD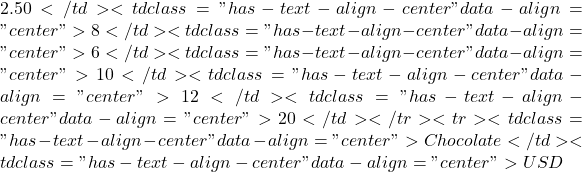 4.00 4.00 | 2 | USD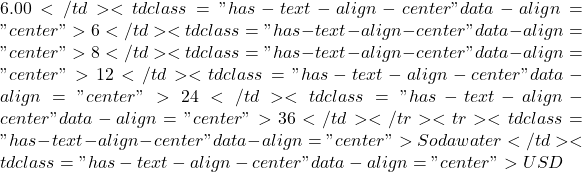 2.50 2.50 | 3 | USD$4.00 | 4 | 7.5 | 12 | 10 | 16 |
| TOTAL: | 26.5 | 44 | 48 | 76 |
Where:
P01 = Index number
P0 = Price in the base year
P1 = Price in the current year
Q0 = Quantity in the base year
Q0 = Quantity in the current year
And:
∑P0Q0 = Sum of prices of the base year multiplied by quantities of the base year taken as weights.
∑P1Q0 = Sum of prices of the current year multiplied by quantities of the base year taken as weights.
∑P0Q1 = Sum of prices of the base year multiplied by quantities of the current year taken as weights.
∑P1Q1 = Sum of prices of the current year multiplied by quantities of the current year taken as weights.
The sums are as follows:
∑P0Q0 = 26.5
∑P1Q0 = 44
∑P0Q1 = 48
∑P1Q1 = 76
1. Laspeyre’s Index Numbers: The base year quantities are used as weights. This base-year method shows changes as business changes base. The Laspeyere’s formula is:
P01 = (∑P1Q0 / ∑P0Q0) x 100
P01 = 44 / 26.5 x 100
P01 = 166.04
The index number of 166.04 shows that the prices of four different products having different importance in the index increased by 66.04% in total between 2021 compared to 2018.
2. Paasche’s Index Numbers: The current year quantities are used as weights. This current-year method recalculates index each year.
P01 = (∑P1Q1 / ∑P0Q1) x 100
P01 = 76 / 48 x 100
P01 = 158.33
The index number of 158.33 shows that the prices of four different products having different importance in the index increased by 58.33% in total between 2021 compared to 2018.
3. Dorbish and Bowley’s Index Numbers: This method takes into account both the base year and the current year for the construction of index numbers. It is the arithmetic mean of Laspeyer’s and Paasche’s methods.
P01 = [(∑P1Q0 / ∑P0Q0) + (∑P1Q1 / ∑P0Q1)] / 2 x 100
P01 = [(44 / 26.5) + (76 / 48)] / 2 x 100
P01 = 162
The index number of 162 shows that the prices of four different products having different importance in the index increased by 62% in total between 2021 compared to 2018.
4. Fisher’s Ideal Index Numbers: The geometric mean of Laspeyre’s and Paasche’s index numbers is used in this method to satisfy the time reversal and factor reversal tests. It takes into account the prices and quantities of both years.
P01 = √[(∑P1Q0 / ∑P0Q0) x (∑P1Q1 / ∑P0Q1)] x 100
P01 = √[(44 / 26.5) x (76 / 48)] x 100
P01 = 162.1
The index number of 162.1 shows that the prices of four different products having different importance in the index increased by 62.1% in total between 2021 compared to 2018.
Uses of weighted index numbers in business management: There are many different types of weighted index numbers in Business Management and Economics. Some examples of weighted index numbers include:
- Retail Price Index (RPI): These indexes measure rate of inflation in a country by finding out how the average household spends its money, e.g. on food, transportation, utilities, clothes, etc. Then, any falls or rises in the prices of those goods and services used by the households are recorded on monthly basis.
- US Dow Jones Industrial Average (DJIA): In these price-weighted stock market indices such as DJIA each component of the index is weighted according to its current share price. Companies with a high share price will have a greater weight than those with a low share price.
Advantages of weighted index numbers: Weighted index numbers are more accurate and realistic than unweighted index numbers as they consider that each observation has a different weight in the index.
Disadvantages of weighted index numbers: Assigning weights seems to be the biggest issue. Weighted index numbers cannot be reliably used to make international comparisons. It is because different countries use different base years and assign different weights in constructing index numbers. Also, different countries will include different items in an index giving different items different importance in different countries.
This article showed in details how numerical data might be summarized using the statistical techniques for calculating change. While index numbers show the relative change in one item of interest (e.g. price, quantity, value, etc.) from one time period to another, weighted index numbers show the changes when different observations in the dataset are assigned different level of importance.
You can find out more about statistical analysis of market research results here.

Comments are closed.