Break-even Quantity shows the level of output that the business must produce and sell at which Sales Revenue equals Total Costs (TC). At Break-even Quantity neither a profit nor a loss is made.
In order to calculate and find out Break-even Quantity, Break-even Analysis shall be undertaken. Break-even Quantity can be determined either by using the Equation Methods or the Graphical Method:
1. The Equation Methods. There are two ways to calculate and determine Break-even Quantity using two different formulae:
a.) The Equation Method 1: Sales Revenue = Total Costs (TC)
b.) The Equation Method 2: Break-even Quantity (BEQ)
2. The Graphical Method. By constructing the Break-even Chart.
The Graphical Method
The Break-even Chart should be constructed to find out Break-even Quantity using the Graphical Method.
The purpose of constructing the Break-even Chart is to show the relationship between the business’s Sales Revenue and various costs at different levels of Output. The Break-even Chart, when properly and clearly constructed, can be used to work out the level of Output that the business must produce and sell to earn Sales Revenue.
Because that Sales Revenue will exactly equal Total Costs (TC) of producing that level of Output, that particular Output will be Break-even Output.
How to construct a simple Break-even Chart?
The Break-even Chart requires two axes. The horizontal x-axis for the number of products produced and sold, and the vertical y-axis for Sales Revenue and Total Costs (TC). Both axes start from 0. The x-axis is labelled as ‘Output (in units)’ and the y-axis is labelled as ‘Costs and Revenues (in USD Of course, calculating Break-even Point does not actually ensure the firm covers all its costs and makes profit. And of course, constructing the Break-even Chart does not mean that the firm has actually sold anything at all. It is simply because Break-even Analysis is a decision-making tool based on theoretical Sales Revenue that managers hope to achieve and expected costs which may change any time.  3,500 per month. Variable Costs (VC) are USD
 30. The maximum number of hamburgers the restaurant can produce per month is 500. Question: How many chicken hamburgers does this retailer must sell per month in order to break-even?Fixed Costs (FC) = USD
 10
Maximum Quantity = 500 chicken hamburgersLet’s calculate Sales Revenue at Maximum Quantity:Sales Revenue at Maximum Quantity = Price x Maximum QuantitySales Revenue at Maximum Quantity = USD
10
Maximum Quantity = 500 chicken hamburgersLet’s calculate Sales Revenue at Maximum Quantity:Sales Revenue at Maximum Quantity = Price x Maximum QuantitySales Revenue at Maximum Quantity = USD 15,000Let’s calculate Total Costs (TC) at Maximum Quantity:Fixed Costs (FC) at Maximum Quantity= USD
 10 x 500
Total Variable Costs (TVC) at Maximum Quantity = USD
10 x 500
Total Variable Costs (TVC) at Maximum Quantity = USD 3,500 + USD
 8,500Now let ‘s draw two lines – one for Sales Revenue starting from 0 up to USD
 3,500 up to USD
 30 x 175
Sales Revenue (TC) at the Break-even Point = USD
30 x 175
Sales Revenue (TC) at the Break-even Point = USD 5,250
5,250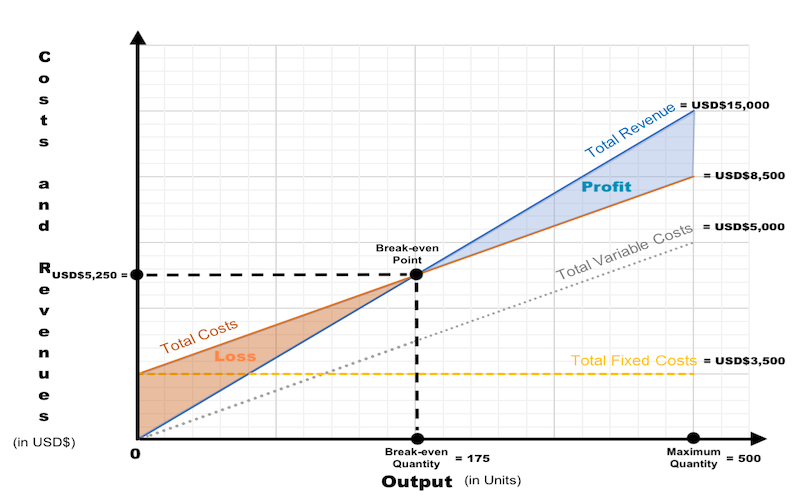

Comments are closed.