Understanding the trajectory of a enterprise requires looking beyond quarterly revenue figures. A thorough corporate evaluation demands an integrated approach that connects broad strategic positioning with rigorous financial diagnostic tools.
Strategic choices dictate operational workflows, which subsequently drive income statements, balance sheet health, and capital structure decisions.
This analysis presents a framework for evaluating a firm’s competitive positioning, operating efficiency, pricing power, and financial stewardship. Real-world corporate examples demonstrate how global market leaders navigate economic cycles, deploy capital, and maintain sustainable long-term value.
Strategic Architecture and Industry Competitive Dynamics
A company’s financial performance originates with its competitive strategy. To generate durable economic rents—returns on invested capital exceeding the firm’s cost of capital—a business must establish a defensible strategic position within its broader industry ecosystem.
       Michael Porter's Generic Strategies Framework

                COMPETITIVE ADVANTAGE
             Cost Leadership     Differentiation
          +-------------------+-------------------+
   Broad  | Broad Cost        | Broad             |
   Target | Leadership        | Differentiation   |
SCOPE     +-------------------+-------------------+
   Narrow | Cost Focus        | Differentiation   |
   Target |                   | Focus             |
          +-------------------+-------------------+
Strategic Positioning Models: Generic Strategies and Industry Structure
Under Michael Porter’s generic strategies framework, corporate success depends on pursuing a clear competitive approach: Cost Leadership, Differentiation, or Focus.
- Cost Leadership: Organizations pursuing cost leadership focus on structural operational efficiency, economies of scale, supply chain power, and strict cost controls. This model allows a firm to remain profitable at price points that starve competitors. Retail giant Walmart illustrates this model by leveraging procurement scale and logistics routing to maintain low prices while achieving high asset turnover.
- Differentiation: Differentiation strategies focus on creating unique value through proprietary design, technological innovation, brand equity, or customer experience. Differentiatied companies can command premium pricing, driving high gross margins. Apple utilizes broad differentiation by combining proprietary hardware, software, and services ecosystems. This integrated model delivers premium user experiences and insulates the company from price competition.
- Focus Strategies: Focus strategies adapt cost leadership or differentiation to a specific niche market, serving dedicated consumer segments that broader competitors overlook.
Evaluating competitive positioning also requires analyzing structural industry pressures using Porter’s Five Forces framework:
| Competitive Force | High-Pressure Scenario | Low-Pressure Scenario | Strategic Mitigation |
| Bargaining Power of Suppliers | Few suppliers; specialized components | Commodity inputs; fragmented suppliers | Vertical integration, dual-sourcing |
| Bargaining Power of Buyers | Low switching costs; transparent pricing | High lock-in; proprietary standards | Ecosystem ecosystems, dynamic pricing |
| Threat of New Entrants | Low capital requirements; no scale barrier | High upfront capital; strong network effects | Scale economies, patent portfolios |
| Threat of Substitutes | Abundant alternative solutions | Unique utility; deeply embedded workflows | Continuous innovation, platform expansion |
| Competitive Rivalry | Stagnant market growth; high fixed costs | Rapidly expanding market; high differentiation | Market segmentation, ecosystem growth |
Industry Value Chains and the Experience Curve
Strategic positioning relies heavily on where a firm sits within the industry value chain. Companies that control critical inputs or direct consumer access capture a disproportionate share of total industry profit pools.
Understanding cost advantages also requires analyzing the Experience Curve, which states that unit production costs decline by a predictable percentage each time cumulative production volume doubles.
![\[C_N = C_1 \cdot N^{-b}\]](https://www.SuperBusinessManager.com/wp-content/ql-cache/quicklatex.com-421517668ddb9d6fcbf2f4d2a71173ea_l3.png "Rendered by QuickLaTeX.com")
Where  represents the cost of the
  -th unit,
  is the cost of the first unit, is cumulative production, and
  is the learning rate elasticity coefficient.
Electric vehicle pioneer Tesla leveraged experience curve effects across battery module assembly and large-scale giga-casting manufacturing processes. By scaling cumulative output faster than legacy automotive manufacturers, Tesla lowered its per-unit manufacturing costs, allowing it to initiate strategic price cuts while protecting its operating margins.
Revenue Dynamics, Operating Margins, and Pricing Power
A firm’s strategic positioning directly impacts its income statement. Converting top-line revenue growth into durable shareholder returns requires favorable unit economics, operating leverage, and strong customer pricing power.
Evaluating Revenue Drivers and Sales Durability
Analyzing revenue begins by breaking total top-line growth into its primary operational components:
![\[\text{Revenue} = \text{Volume (Units Sold)} \times \text{Realized Price (Average Selling Price)}\]](https://www.SuperBusinessManager.com/wp-content/ql-cache/quicklatex.com-1a573d33f0cf7be40c940fed7bfda6d7_l3.png "Rendered by QuickLaTeX.com")
Qualitative and quantitative factors that determine revenue sustainability include:
- Organic vs. Inorganic Growth: Organic growth stems from expanding market share, launching products, or tapping new demographics. Inorganic growth relies on mergers and acquisitions. Organic growth generally indicates healthier core operations and higher internal return on capital.
- Recurring Revenue Streams: Enterprise software platforms like Microsoft shifted from perpetual license models to cloud-based software-as-a-service subscriptions (e.g., Microsoft 365 and Azure). Subscription models provide predictable cash flows, lower customer acquisition costs over time, and higher lifetime customer value.
- Customer Concentration and Diversification: High revenue concentration among a small number of enterprise accounts increases cash flow volatility. Broad customer diversification builds earnings stability across economic cycles.
Operating Profitability and Structural Cost Profiles
Operating profitability measures how effectively management translates top-line revenue into operating income (EBIT). This evaluation relies on three key margins:
- Gross Profit Margin:
 — Measures basic product economics and primary manufacturing efficiency.
 - Operating Profit Margin (EBIT Margin):
 — Reflects core operational performance, including sales, marketing, research, and overhead management.
 - EBITDA Margin:
 — Serves as a proxy for operating cash generation by removing non-cash depreciation and amortization expense.
A company’s operational risk profile depends heavily on its balance between fixed and variable costs, known as Degree of Operating Leverage (DOL):
![\[\text{DOL} = \frac{\% \Delta \text{ Operating Income}}{\% \Delta \text{ Revenue}} = \frac{\text{Revenue} - \text{Variable Costs}}{\text{Operating Income}}\]](https://www.SuperBusinessManager.com/wp-content/ql-cache/quicklatex.com-8781ee3816e8c877844fc9385b124217_l3.png "Rendered by QuickLaTeX.com")
High fixed-cost structures create high operating leverage. When revenue increases, operating income expands rapidly because incremental revenues bear few variable expenses. Conversely, during revenue downturns, high operating leverage accelerates margin compression.
For example, semiconductor manufacturers experience significant operating leverage due to the multi-billion USD capital expenditures required to build fabrication plants. When chip demand climbs, factory utilization increases and profit margins expand rapidly; during industry downturns, fixed depreciation costs weigh heavily on profitability.
       Operating Margin Profiles Across Industry Structures

   100% +-------------------------------------------------------+
        |                                                       |
    80% |   Software / Platforms (e.g., Enterprise SaaS)       |
        |   - Low variable costs, scalable software delivery    |
    60% |                                                       |
        |   Specialty Consumer / Hardware (e.g., Apple)          |
    40% |   - Premium hardware pricing with growing services    |
        |                                                       |
    20% |   High-Volume Retail (e.g., Walmart)                 |
        |   - Thin operating margins offset by high inventory turnover |
     0% +-------------------------------------------------------+
Quantifying Pricing Power and Price Elasticity of Demand
Pricing power is the single most important metric in assessing a firm’s competitive moat. It represents a company’s ability to raise prices without losing market share or sales volume to competitors. Pricing power is mathematically measured by the Price Elasticity of Demand ( ):
):
![\[E_d = \frac{\% \Delta Q}{\% \Delta P} = \frac{(Q_2 - Q_1) / Q_1}{(P_2 - P_1) / P_1}\]](https://www.SuperBusinessManager.com/wp-content/ql-cache/quicklatex.com-b49ec888810add9d72499d65e0a6138a_l3.png "Rendered by QuickLaTeX.com")
- Elastic Demand (
 ): Small price increases cause significant drops in sales volume. Products are commodities with abundant market substitutes.
 - Inelastic Demand (
 ): Price increases cause minimal drops in sales volume. Products possess high switching costs, brand loyalty, or proprietary IP.
Global luxury goods conglomerate LVMH exhibits strong pricing power. Thanks to its heritage branding, luxury positioning, and limited distribution channels, LVMH routinely raises prices above prevailing inflation rates without decreasing unit volume. This generates high gross margins and durable operational cash flows.
Balance Sheet Mechanics: Capital Allocation, Working Capital, and Financial Architecture
While the income statement captures operational earnings over time, the balance sheet reveals the financial strength, liquidity, and structural capital efficiency supporting those operations.
Working Capital Management and Cash Conversion Dynamics
Working capital efficiency reflects how effectively management handles day-to-day liquidity and operational assets. Net Working Capital (NWC) is calculated as:
![\[\text{Net Working Capital} = \text{Current Assets} - \text{Current Liabilities}\]](https://www.SuperBusinessManager.com/wp-content/ql-cache/quicklatex.com-7a71ec993a1340f8cd28cd0e20f1c1ad_l3.png "Rendered by QuickLaTeX.com")
Evaluating operational working capital management relies on the Cash Conversion Cycle (CCC), which measures the elapsed time (in days) between cash outlay for raw materials and cash collection from sales:
![\[\text{CCC} = \text{DIO} + \text{DSO} - \text{DPO}\]](https://www.SuperBusinessManager.com/wp-content/ql-cache/quicklatex.com-ae27ed57b1e09c11d34cb5be5dea86f4_l3.png "Rendered by QuickLaTeX.com")
Where:
- Days Sales Outstanding (DSO):

- Days Inventory Outstanding (DIO):
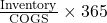
- Days Payables Outstanding (DPO):

                  Cash Conversion Cycle (CCC) Flow

   +-----------------------------------------------------------+
   | (1) Purchase Raw Materials    ---> Cash Outflow           |
   +-----------------------------------------------------------+
   |<----------- Days Inventory Outstanding (DIO) ------------>|
   |                                                           |
   |                  +----------------------------------------+
   |                  | (2) Sell Finished Product              |
   |                  +----------------------------------------+
   |                  |<-- Days Sales Outstanding (DSO) ------>|
   |                                                           |
   |<-- Days Payables Outstanding (DPO) -->|                   |
   +---------------------------------------+-------------------+
   | Cash Outlay                           | Cash Collected    |
   +---------------------------------------+-------------------+
                                           |<-- CCC (Days) --->|
Optimizing working capital reduces the total cash locked in core operations. Dell Technologies historically transformed PC manufacturing by deploying a direct-to-consumer build-to-order system. By collecting payment from buyers before purchasing components from vendors, Dell achieved a negative Cash Conversion Cycle. This strategy allowed Dell to generate operating liquidity from organic growth rather than relying on external bank financing.
Capital Investments and Organic Growth Frameworks
Capital expenditures (CapEx) represent long-term capital investments in fixed assets, technology infrastructure, and production facilities intended to generate cash flow over multi-year horizons. Evaluating capital deployment efficiency relies on disciplined capital budgeting metrics:
1. Return on Invested Capital (ROIC)
ROIC measures how effectively management generates operating profits relative to the total capital provided by equity holders and debt investors:
![\[\text{ROIC} = \frac{\text{NOPAT}}{\text{Total Debt} + \text{Equity} - \text{Cash}} = \frac{\text{EBIT} \times (1 - t)}{\text{Invested Capital}}\]](https://www.SuperBusinessManager.com/wp-content/ql-cache/quicklatex.com-d17b3c98bee576269f8b5e2ec95a8769_l3.png "Rendered by QuickLaTeX.com")
When ROIC consistently exceeds the firm’s Weighted Average Cost of Capital (WACC), management creates economic value ( ).
).
2. Net Present Value (NPV)
NPV discounts expected future cash flows back to present values using the enterprise hurdle rate:
![\[\text{NPV} = \sum_{t=1}^{n} \frac{\text{CF}_t}{(1 + r)^t} - \text{Initial Outlay}\]](https://www.SuperBusinessManager.com/wp-content/ql-cache/quicklatex.com-638de5b21383f31fd2fdc2f25e3629fc_l3.png "Rendered by QuickLaTeX.com")
Projects with positive NPV values add value for equity shareholders and earn an absolute return above the cost of capital.
3. Internal Rate of Return (IRR)
IRR reflects the specific discount rate where a capital project’s Net Present Value equals zero:
![\[0 = \sum_{t=1}^{n} \frac{\text{CF}_t}{(1 + \text{IRR})^t} - \text{Initial Outlay}\]](https://www.SuperBusinessManager.com/wp-content/ql-cache/quicklatex.com-0e8531abacaf5bdffe935d4ef727ac2f_l3.png "Rendered by QuickLaTeX.com")
Target investments must generate an IRR that exceeds the corporate hurdle rate to justify capital deployment.
When evaluating capital expenditures, financial analysts split commitments into Maintenance CapEx (capital required to maintain current operating capacity) and Growth CapEx (capital committed to expanding future operations).
Hyper-scale technology firms, including Amazon Web Services and Microsoft Azure, allocate tens of billions USD annually toward growth CapEx to build global data centers and specialized AI hardware platforms. These capital investments build long-term infrastructure moats that scale future cash collection.
       The Strategic Capital Allocation Decision Tree

                          Operating Cash Flow
                                   |
                  +----------------+----------------+
                  |                                 |
         Reinvest in Business               Return to Capital Providers
                  |                                 |
         +--------+--------+               +--------+--------+
         |                 |               |                 |
    Organic CapEx       Strategic      Debt Retirement    Share Buybacks /
  (R&D, Facilities)       M&A         (Deleveraging)      Cash Dividends
Financial Capital Structure and Leverage Optimization
A company’s capital structure—its strategic mix of debt and equity financing—determines its capital cost, cash flow commitments, and financial risk profile.
     Optimal Capital Structure & Cost of Capital Curve

  Cost of Capital (%)
     ^
     |
     |  \                                        /  Cost of Equity (Ke)
     |   \                                      /
     |    \          Optimal Capital           /
     |     \            Structure             /   WACC
     |      \              |                 /
     |-------\-------------v----------------/-------------------
     |        \        .-------.           /
     |         \______/         \_________/      Cost of Debt (Kd)
     |
     +------------------------------------------------------------>
     0%                      Leverage (Debt/Equity Ratio)    100%
Debt vs. Equity Financing Trade-offs
Debt financing offers tax deductibility advantages (the interest tax shield) and avoids diluting existing shareholders. However, debt introduces mandatory periodic cash payments that increase financial distress risks during economic downturns.
Equity financing provides flexible risk capital without mandatory payment obligations, but it dilutes ownership and carries a higher overall cost because equity holders take on residual business risk.
The Weighted Average Cost of Capital (WACC)
WACC represents the blended cost of financing across all corporate capital providers:
![\[\text{WACC} = \left( \frac{E}{V} \times K_e \right) + \left( \frac{D}{V} \times K_d \times (1 - t) \right)\]](https://www.SuperBusinessManager.com/wp-content/ql-cache/quicklatex.com-bd170747980ed3cecd8ad3e14a80b356_l3.png "Rendered by QuickLaTeX.com")
Where  is total market equity value,
  is total book/market debt value,
  ,
,  is the cost of equity,
  is the pre-tax cost of debt, and
  is the corporate tax rate.
Under the Modigliani-Miller Theorem with Taxes, adding lower-cost debt to the capital structure reduces WACC because interest payments are tax-deductible ( ). However, as debt levels increase, financial distress costs climb, raising the cost of equity () and eventually increasing the overall WACC. The optimal capital structure minimizes WACC while maximizing total enterprise value.
Evaluating Balance Sheet Risk Profiles
Assessing financial risk and structural solvency requires three key debt metrics:
- Debt-to-EBITDA:
 — Measures the years of cash generation required to repay nominal outstanding debt.
 - Interest Coverage Ratio:
 — Evaluates a company’s safety buffer for servicing annual interest payments out of current operating profits.
 - Debt-to-Equity (D/E):
 — Reflects total financial leverage relative to investor capital buffers.
To see how these financial performance and capital structure metrics come together, consider this comparison across three distinct corporate business models:
| Metric | Enterprise Tech (e.g., Apple / Microsoft) | High-Volume Retail (e.g., Walmart) | Heavy Industrial / Automotive |
| Gross Margin Profile | Very High (45% – 70%) | Low (20% – 25%) | Moderate (15% – 25%) |
| Operating Margin (EBIT) | High (30% – 45%) | Thin (4% – 6%) | Cyclical (6% – 12%) |
| Cash Conversion Cycle | Negative to Neutral | Exceptionally Low (Fast) | High (Inventory Bound) |
| Capital Intensity (CapEx/Sales) | Low to Moderate (Asset-Light) | Moderate (Store Logistics) | High (Fab/Plant Heavy) |
| Dominant Capital Structure | Low Net Debt / Large Cash Reserves | Moderate Debt / Stable Leverage | Higher Financial & Fixed Leverage |
| Primary ROIC Engine | High Operating Profit Margins | High Capital/Inventory Turnover | Scale Operations & Utilization |
Synthesis: An Integrated Framework for Business Analysis
Comprehensive corporate analysis evaluates how competitive strategy, operational management, and financial execution work together to drive economic value.
                  Integrated Corporate Evaluation Engine

   +------------------------------------------------------------------+
   |                       STRATEGIC POSITION                         |
   |   Competitive Moat * Industry Dynamics * Generic Positioning      |
   +------------------------------------------------------------------+
                                   |
                                   v
   +------------------------------------------------------------------+
   |                     OPERATIONAL PERFORMANCE                      |
   |   Pricing Power * Revenue Growth * Operating Margin Efficiency   |
   +------------------------------------------------------------------+
                                   |
                                   v
   +------------------------------------------------------------------+
   |                     CAPITAL ALLOCATION                           |
   |   ROIC Optimization * Working Capital * Capital Structure        |
   +------------------------------------------------------------------+
                                   |
                                   v
   +------------------------------------------------------------------+
   |                     SHAREHOLDER VALUE                            |
   |   Sustainable Free Cash Flow * Economic Value Added (EVA)        |
   +------------------------------------------------------------------+
Evaluating a company’s past performance, present condition, and future trajectory requires answering three fundamental questions:
- Strategic Moats: Does the company maintain a structural competitive advantage that protects its market share and preserves pricing power against industry rivals?
- Operational Performance: Is management converting revenue growth into cash profits through strong operating margins, disciplined cost controls, and efficient working capital management?
- Capital Allocation: Is management allocating balance sheet capital into high-ROIC projects that exceed the company’s cost of capital, while optimizing its long-term financial structure?
When competitive strategy, operational execution, and capital allocation align, a firm builds a defensible market position, withstands macro economic challenges, and creates long-term value for shareholders.
