The cost of capital serves as the foundational discount rate in corporate finance, linking future cash flows to present enterprise value.
Acting as the minimum hurdle rate for capital budgeting decisions, it represents the opportunity cost that investors demand for allocating capital to a specific enterprise given its risk profile. For decision-makers ranging from corporate executives and board directors to investors and strategic advisors, mastering advanced cost of capital mechanics is critical for evaluating capital structure optimization, conducting accurate valuations, and maximizing long-term enterprise value.
This analysis explores top-down and bottom-up determinants of capital costs, methods for estimating the cost of debt and the equity risk premium, required return on equity models, practical estimations for public and private firms, and peer benchmarking protocols.
Top-Down and Bottom-Up Factors Impacting the Cost of Capital
Evaluating the cost of capital requires synthesizing broad macroeconomic realities with granular, firm-specific operational risks. Analysts partition these considerations into top-down and bottom-up drivers.
Top-Down Macroeconomic and Industry Factors
Top-down drivers establish the baseline hurdle rate dictated by systemic economic conditions and broad sector dynamics:
- Risk-Free Rate (

- Macroeconomic Growth and Business Cycles: Broad economic expansion reduces systemic default probabilities, tightening corporate credit spreads and lowering capital costs. Conversely, economic contraction or stagflation raises systemic volatility, forcing investors to demand wider risk premiums.
- Regulatory and Legal Environment: Industry-specific regulatory frameworks—such as price caps for utility providers or stringent compliance mandates for pharmaceutical firms—shape cash flow predictability and alter systematic risk exposure.
- Geopolitical and Sovereign Risk: For multinational operations or firms located in emerging markets, systemic country risk premiums (CRP) must be layered on top of baseline rates to compensate for currency depreciation, transfer risks, and political instability.

Bottom-Up Microeconomic and Firm-Specific Factors
Bottom-up drivers capture the unique operational and financial structures of individual organizations:
- Operating Leverage: Firms with high fixed operating costs relative to variable costs exhibit volatile operating income (EBIT) in response to revenue changes. This operational vulnerability amplifies business risk, driving up the cost of equity.
- Financial Leverage: The proportion of debt utilized in the capital structure introduces financial risk. As a company borrows more, equity risk increases because debt holders hold a senior claim on cash flows, compounding equity volatility and triggering higher default risk spreads.
- Size and Liquidity Premia: Smaller firms frequently face higher costs of capital due to limited access to capital markets, thinner analyst coverage, less diversified revenue streams, and lower stock liquidity.
- Asset Quality and Earnings Transparency: Organizations with predictable cash flows, high earnings quality, and transparent financial reporting benefit from lower perceived information asymmetry, resulting in reduced cost of capital demands from capital providers.
Comparison of Methods Used to Estimate the Cost of Debt
The cost of debt (


| Estimation Method | Core Mechanics & Formula | Advantages | Limitations |
| Yield to Maturity (YTM) of Existing Bonds | Calculates the internal rate of return equating the current market price of a firm’s publicly traded debt to its future coupon and principal cash flows. | Reflects current, real-time market pricing and prevailing investor sentiment for the specific firm. | Requires the firm to have actively traded liquid bonds in secondary markets; historical yields may be distorted by low liquidity. |
| Debt Rating / Synthetic Rating Approach | Maps a company’s financial ratios (such as the Interest Coverage Ratio) to synthetic credit ratings and corresponding default spreads over the risk-free rate. | Highly versatile; enables estimation for private firms or companies lacking publicly traded debt instruments. | Relies on historical accounting data and mapping approximations that may lag behind sudden shifts in credit quality. |
| Bank Borrowing Rate / Current Lending Rate | Utilizes the interest rates quoted on recent bank term loans, revolving credit facilities, or private placements. | Directly reflects actual cost terms negotiated with commercial financial institutions. | May be constrained by relationship banking terms, specific collateral requirements, or restricted access to broader capital markets. |
Historical and Forward-Looking Approaches to Estimating an Equity Risk Premium
The Equity Risk Premium (ERP)—defined as the excess return that investors demand for investing in a broad equity market portfolio over a risk-free asset—is the most volatile component of cost of equity models. Analysts deploy two primary methodological approaches.
Historical (Retrospective) Approaches
Historical ERP relies on realized historical returns over long time horizons, typically comparing stock market indices (such as the S&P 500) to government bond yields.
- Arithmetic Mean vs. Geometric Mean: The arithmetic mean calculates simple annual differences, which can upwardly bias long-term projections. The geometric mean incorporates compounding effects, which can downwardly bias multi-period expectations.
- Key Considerations: While straightforward to compute, historical approaches assume that the risk preferences of past investors mirror those of current markets. They are highly sensitive to the chosen time horizon (e.g., periods containing major wars or economic depressions skew results) and suffer from survivorship bias (focusing on markets that survived and prospered, like the U.S., ignoring failed markets).
Forward-Looking (Implied / Prospective) Approaches
Forward-looking approaches bypass historical return data by extracting expected returns directly from current asset prices and cash flow forecasts.
- Implied ERP (IEP) via Dividend Discount Models (DDM): Using the Gordon Growth Model, the current index price (


![\[\text{ERP}_{\text{implied}} = \left( \frac{D_1}{P_0} + g \right) - R_f\]](https://www.SuperBusinessManager.com/wp-content/ql-cache/quicklatex.com-1275581f29f63bdc1b6530d974af4340_l3.png "Rendered by QuickLaTeX.com")
- Macroeconomic Fundamental Models: These approaches build expected returns by summing inflation expectations, real economic growth rates, and dividend yields, adjusting for structural shifts in market valuation multiples.
- Advantages: Forward-looking models dynamically adjust to current market valuations and macroeconomic conditions, making them superior during periods of structural market regime change. However, they remain sensitive to analysts’ forecasting errors regarding growth rates.


Comparison of Methods Used to Estimated the Required Return on Equity
The required return on equity (

| Method | Core Formula / Mechanics | Primary Inputs | Key Limitations |
| Capital Asset Pricing Model (CAPM) |  | Risk-free rate, Equity Beta ( | Relies heavily on backward-looking beta estimations and assumes beta is a complete measure of systematic risk. |
| Multi-Factor Models (e.g., Fama-French 3-Factor Model) |  | Market factor, Size factor (Small Minus Big), Value factor (High Minus Low) | Increases estimation complexity; factor premiums can vary significantly across global markets and economic cycles. |
| Build-Up Method |  | Risk-free rate, ERP, industry risk, size premium, specific risk adjustments | Heavily reliant on subjective judgment when assigning numerical values to company-specific and operational risks. |


Estimating the Cost of Capital for a Public Company vs. a Private Company
Executing cost of capital estimations highlights stark methodological contrasts between publicly traded corporations and private enterprises due to data visibility and market liquidity constraints.
Public Company Estimation Workflow
For a public company (e.g., Apple Inc.), market data is readily accessible:
- Cost of Debt: Determined using the weighted average yield-to-maturity of its active corporate bonds or credit ratings from agencies like S&P and Moody’s.
- Cost of Equity via CAPM:
- Retrieve the current 10-year Treasury yield for
- Obtain regression-based equity beta (
- Apply an established market ERP (e.g., 5.0% to 5.5%).
- Retrieve the current 10-year Treasury yield for
- Capital Structure Weightings: Compute market-value weights based on total market capitalization (Equity Value) and the market/book value of total debt.
Private Company Estimation Workflow
Private companies lack traded equity shares and public debt instruments, requiring specialized proxies:
- Cost of Debt: Estimated via bank borrowing rates on commercial term loans or by assigning a synthetic credit rating based on the private firm’s interest coverage ratio relative to public industry peers.
- Cost of Equity via Pure-Play Betas and Build-Up:
- Unlevering/Relevering Beta: Because private betas cannot be directly observed, analysts identify a set of comparable public industry peers, unlever their betas (
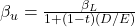
- Adding Private Risk Premia: Because private shares suffer from severe illiquidity and concentration risks, practitioners add a Size Premium (for smaller operations) and a Company-Specific Risk Premium (CSR) (ranging from 0% to 10%+) to account for owner dependence and revenue volatility.
- Unlevering/Relevering Beta: Because private betas cannot be directly observed, analysts identify a set of comparable public industry peers, unlever their betas (

Evaluating a Company’s Capital Structure and Cost of Capital Relative to Peers
Strategic financial management requires assessing whether a firm’s capital structure minimizes its Weighted Average Cost of Capital (WACC) and maximizes overall enterprise value relative to industry peers.
The Modigliani-Miller Framework and Trade-Off Theory
- Modigliani-Miller (with Taxes): Demonstrates that firm value increases with leverage due to the tax shield generated by interest deductibility:
![\[\text{WACC} = \left(\frac{E}{V}\right) K_e + \left(\frac{D}{V}\right) K_d (1 - t)\]](https://www.SuperBusinessManager.com/wp-content/ql-cache/quicklatex.com-1b8ed060d0182d75474d5fa420e52a0c_l3.png "Rendered by QuickLaTeX.com")
- Trade-Off Theory: As a firm increases its debt weighting, it substitutes more expensive equity with cheaper tax-shielded debt. However, excessive leverage elevates financial distress and bankruptcy costs, pushing up both borrowing rates and equity return requirements. The optimal capital structure is achieved precisely where WACC is minimized and firm value is maximized.

Comparative Peer Benchmarking Protocol
To evaluate a peer group effectively, financial analysts execute a structured comparison:
- Peer Group Selection: Identify direct competitors within the same Global Industry Classification Standard (GICS) sector possessing similar business models, operating leverage characteristics, and geographic revenue footprints.
- Capital Structure Matrix Construction: Compare financial leverage ratios—such as Total Debt-to-Capital, Debt-to-EBITDA, and Interest Coverage—against peer medians.
- WACC Component Benchmarking:
- Benchmark the target firm’s cost of equity against peers to verify if market perceptions indicate excessive operational or financial risk.
- Evaluate credit spreads to determine if the firm borrows at favorable terms relative to competitors with similar credit metrics.
- Strategic Recommendations: If a peer group maintains lower WACC figures driven by optimal leverage thresholds, management can consider recapitalization strategies, debt optimization, or asset divestitures to align capital structure with value maximization goals.
Summary
The cost of capital functions as the essential hurdle rate for corporate investment decisions, influenced by top-down macroeconomic variables like risk-free rates and regulatory environments, as well as bottom-up firm-specific drivers such as operating and financial leverage.
Estimating its components involves evaluating the after-tax cost of debt via market yields or synthetic ratings, and determining the required return on equity using historical or forward-looking equity risk premiums through models like the Capital Asset Pricing Model or multi-factor frameworks.
While public companies leverage observable market data and traded securities, private firms require specialized adjustments including pure-play comparable asset betas and illiquidity premia.
Ultimately, evaluating these metrics against industry peers enables management to optimize capital structures, balance tax shields with financial distress costs, and minimize the Weighted Average Cost of Capital to maximize enterprise value.

