To properly construct the Break-even Chart, we need to plot the curves that indicate Sales Revenue and Total Costs (TC). The Sales Revenue and costs information at 0 Output level and maximum Output level is used to produce the Break-even Chart.
To construct an accurate Break-even Chart, use the following five rules.
STEP 1: Let’s start with adding the title to the chart. Then, the x-axis is labelled as ‘Output (in units)’ and the y-axis is labelled as ‘Costs and Revenues (in USD The Break-even Chart for the above example, will then look like this: Break-even Point indicates the costs and revenues at Break-even Quantity. The point at which the total-cost line and sales-revenue line cross each other is Break-even Point.  260. The Average Variable Costs (AVC) to produce one dress are USD
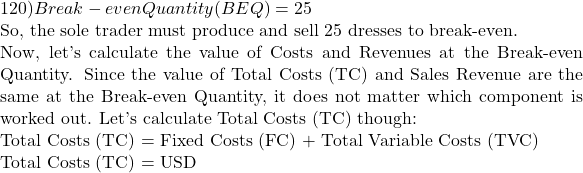
 3,500. To construct the Break-even Chart, it is necessary to first calculate Break-even Quantity. Using The Equation Method 2: Break-even Quantity (BEQ), the Contribution Per Unit can be calculated, and the Break-even Quantity can be worked out as:Break-even Quantity (BEQ) = Fixed Costs (FC) / Contribution Per UnitBreak-even Quantity (BEQ) = USD
 260 – USD
 3,500 + (USD
 6,500Equally, if we calculate the Sales Revenue, the figure would be the same:Sales Revenue = USD
 6,500So, if the sole trader produces and sells 25 dresses, Total Costs (TC) will be USD
 6,500.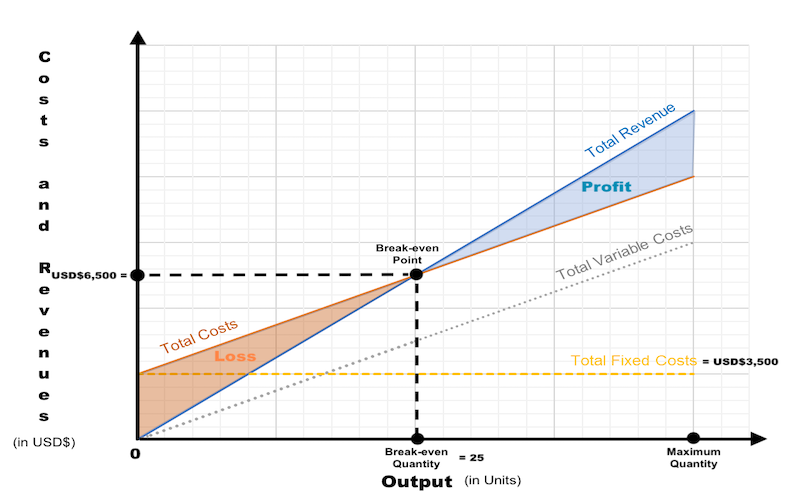

Comments are closed.